THE STORY
01
The inspiration for this project came from a discussion I held with my friend Rebecca Bossart about how the EMR ( Electronic medical record software used by Doctors in Utah) was never developed keeping the Doctors usability in mind.
Though we came from divergent backgrounds ( me, an Indian Architect and Rebecca an American UX designer ), we had experienced similar pain points in design development stage. Where the user's voice would be lost in the design process, business, and marketing requirements for the product.
We decided to collaborate to find a solution to this problem we often experienced as designers. This led to the development of Eve.
The project was executed under the mentorship of Ms. Irene Pereyra ( co-founder of Anton and Irene, a Brooklyn based studio). It was a part of a 9-week course of User Experience Design and Content strategy at Harbour.Space University.
As the project showed immense potential after the 9-weeks of User research and study, we are continuing to develop the product as a management tool that could be used by UX designers.
CHALLENGE
02
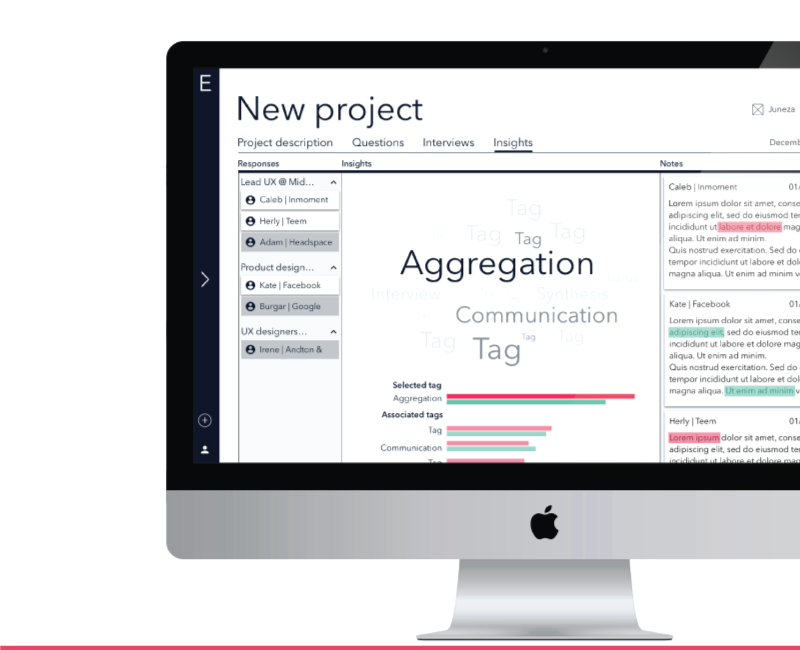
Creating a model that can synthesize and communicate the user’s behavior and painpoints collected by the UX designers, (ideally at the discovery stage ) in the form of Data Visualization to other stakeholders in the company.
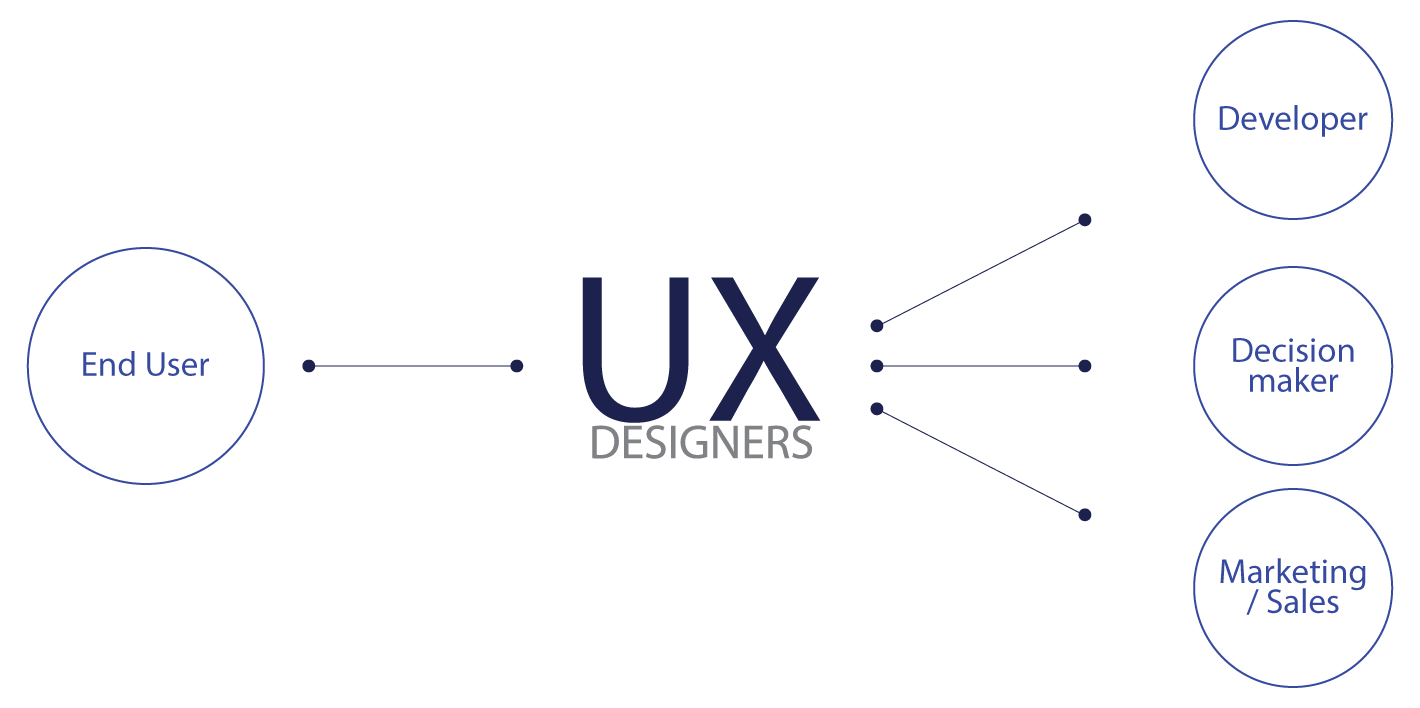
As UX designers we act as a bridge to facilitate communication between the end user and the stakeholders.
APPROACH
03
Hypothesis
The fundamental pain point of every UX research is deriving unbiased inferences from the raw data collected during the interview process.
Ecosystem Analysis
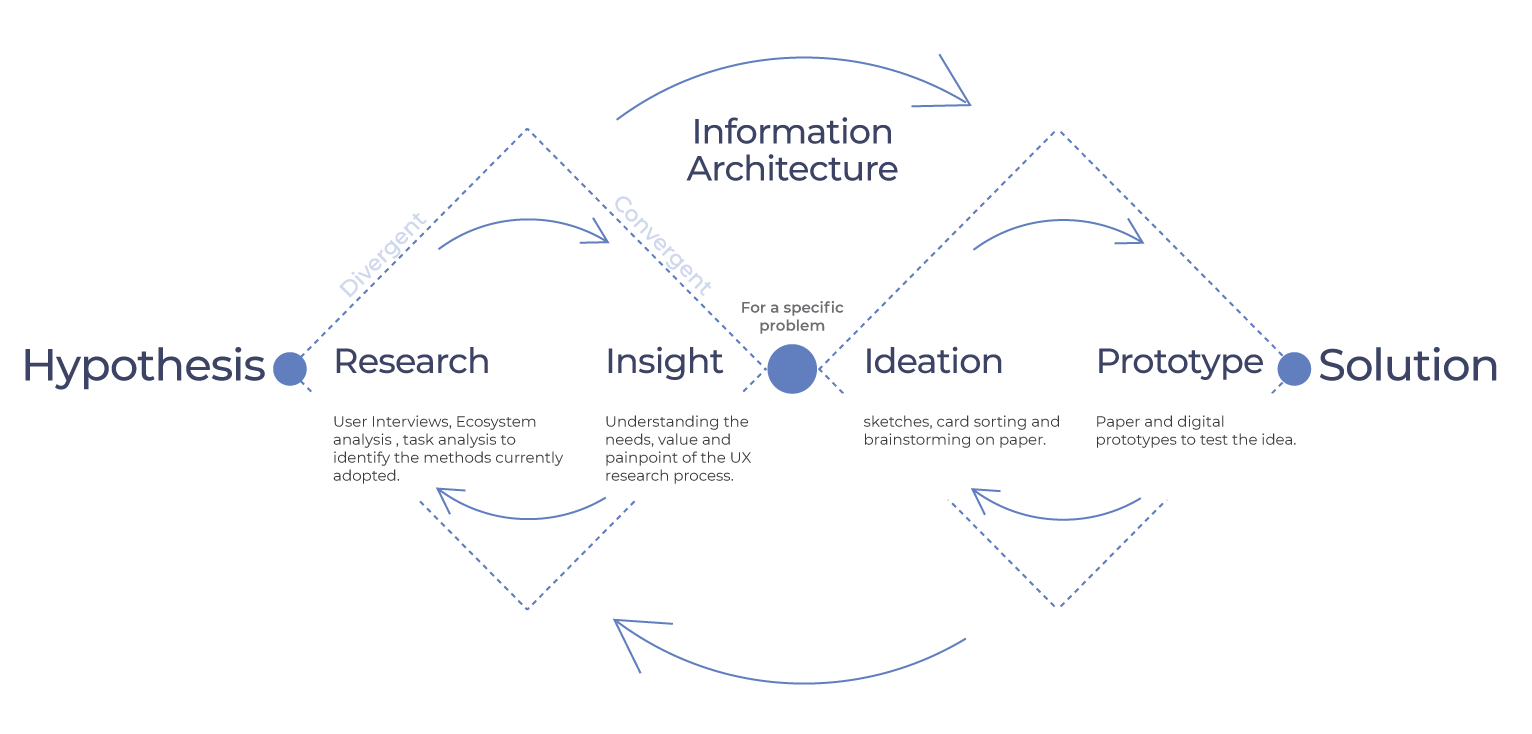
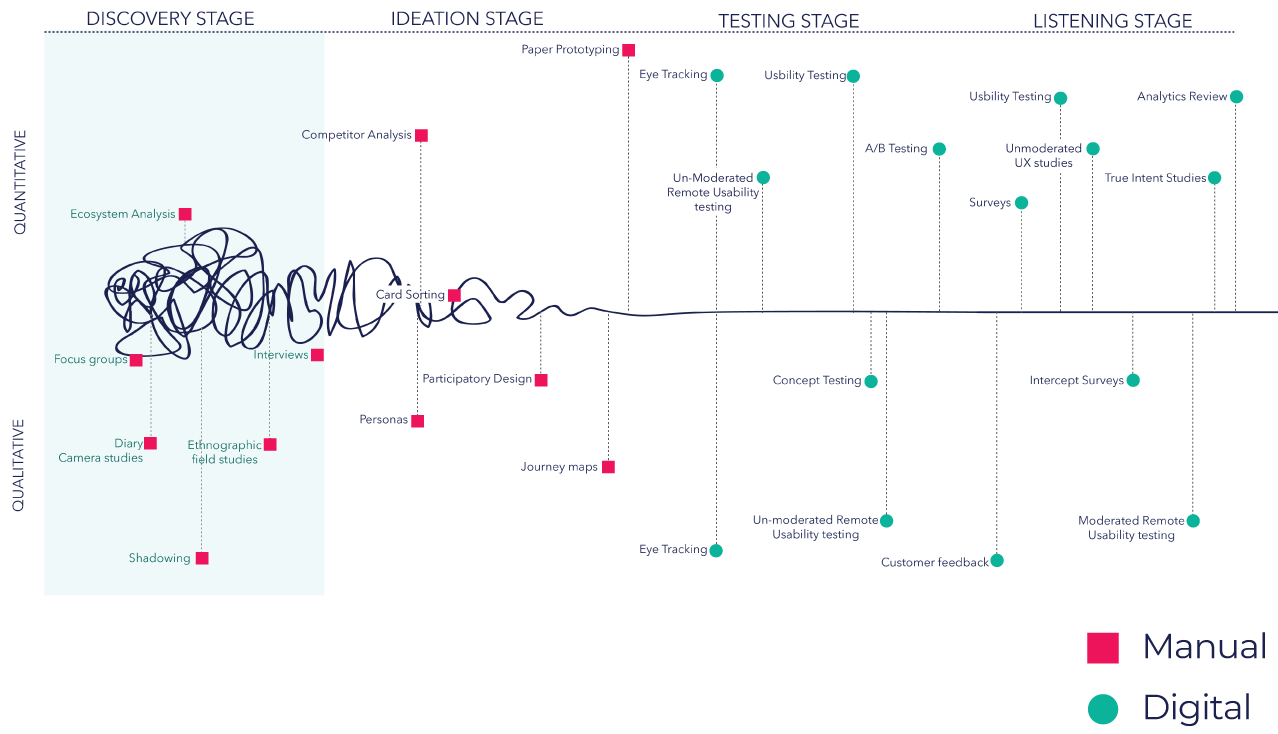
We listed out all the tools and processes currently adopted by the UX designers to carry out their research. We categorized them into the four phases of product development.

The line represents the journey of product development, it is categorized under the four different phases that guide the progress.
From the above diagram, it is evident that product development is very tangled at the Discovery Stage;but it slowly de-tangles itself as it moves across the other stages. It is like a game of Chinese whispers, if you are not listening at this stage the information could translate to a completely irrelevant product or service.
Within each of the phase we looked for the following parameters-
1. User testing and research methods that had to be conducted Manually Vs Digitally
2. If the analysis was Quantitative vs Qualitative.
3. If the research findings were conducted only by the UX designer or were there other stake holders involved in the process.
4. How were the research findings communicated with other stakeholders in the company ( like the developers / marketing and sales team etc)
Plotting the Eco-system Analysis on a graph to communicate effectively within our team
User Interviews
To validate our hypothesis and further understand the process of aggregation, synthesis and collaboration methodologies currently followed by different UX designers, we conducted 18 interviews.
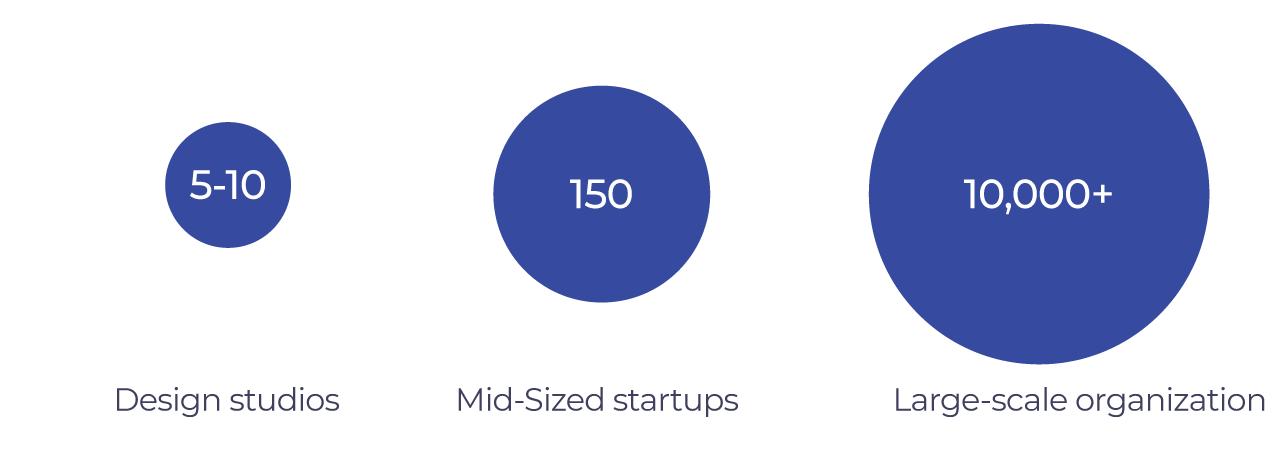
Who we interviewed - The range of our interviewees spanned across varying scale of organization and responsibility.
Type 1 - Scale of organization
Number of employees:
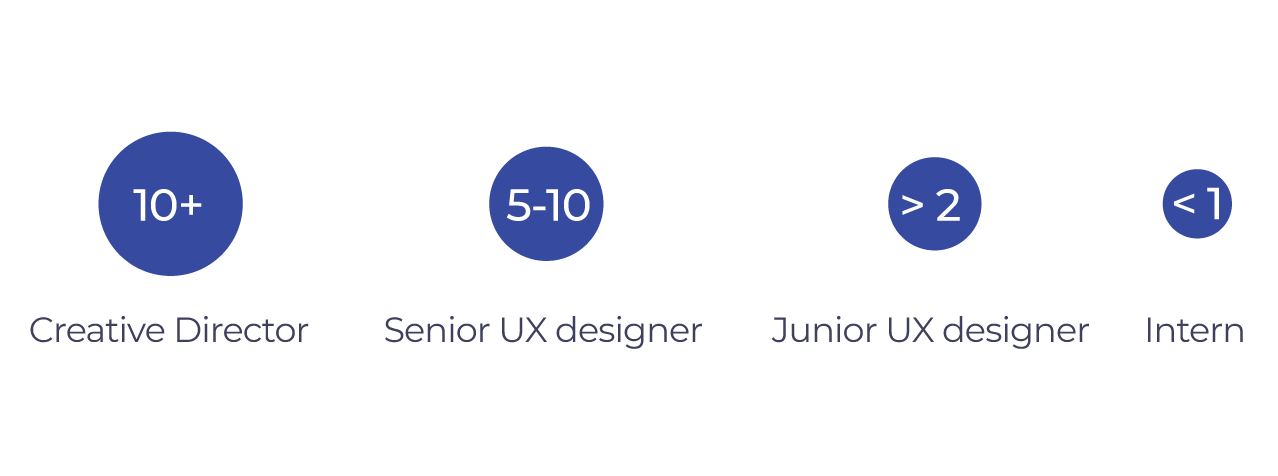
Type 2 - Range of responsibility
Years of experience :
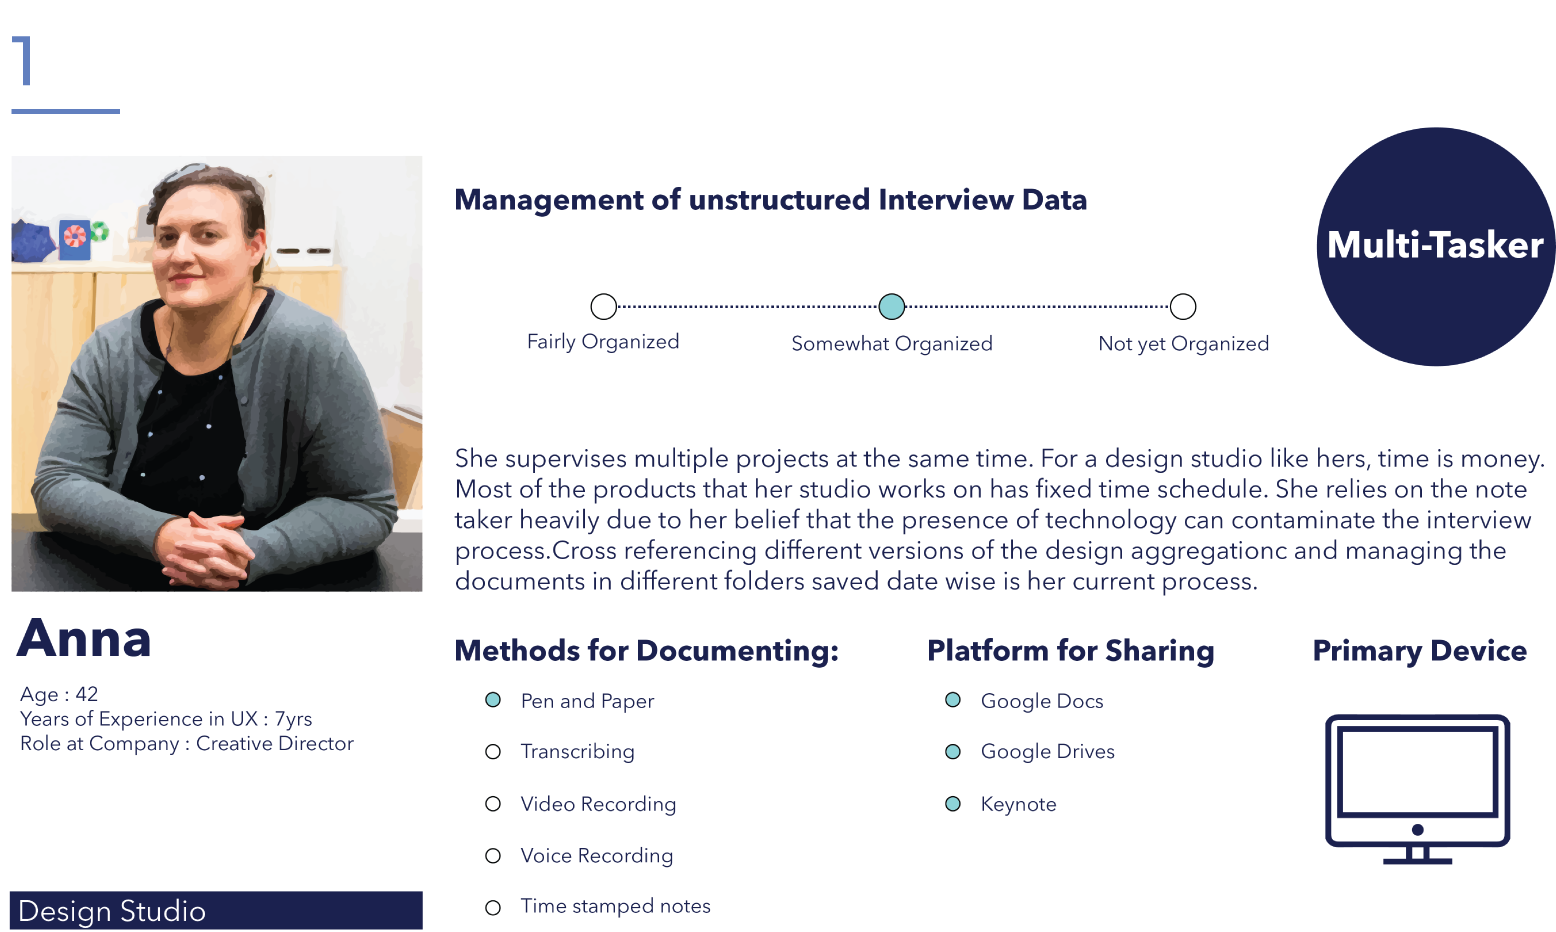
The range of our interviewees spanned across designers owning their own design studio, startups, mid-sized firms, large organizations like Google and the interns who are usually assigned the tedious task of transcribing the interviews.
Insights from the interview :
From the interviews, it was evident that the predominant platform used by the designers were google suits, notebook, audio recording for most of their manual research and documentation. UX research and documentation is a cyclic process that informs the product development and business strategy.
User interviews are conducted quarterly or prior to introducing a new feature in the product. We realized that it was a tedious task for the designers to derive patterns or insight from the data that they have gathered over the years. Another key pain point was the translation of the gathered data to actionable insights for different stakeholders.
"
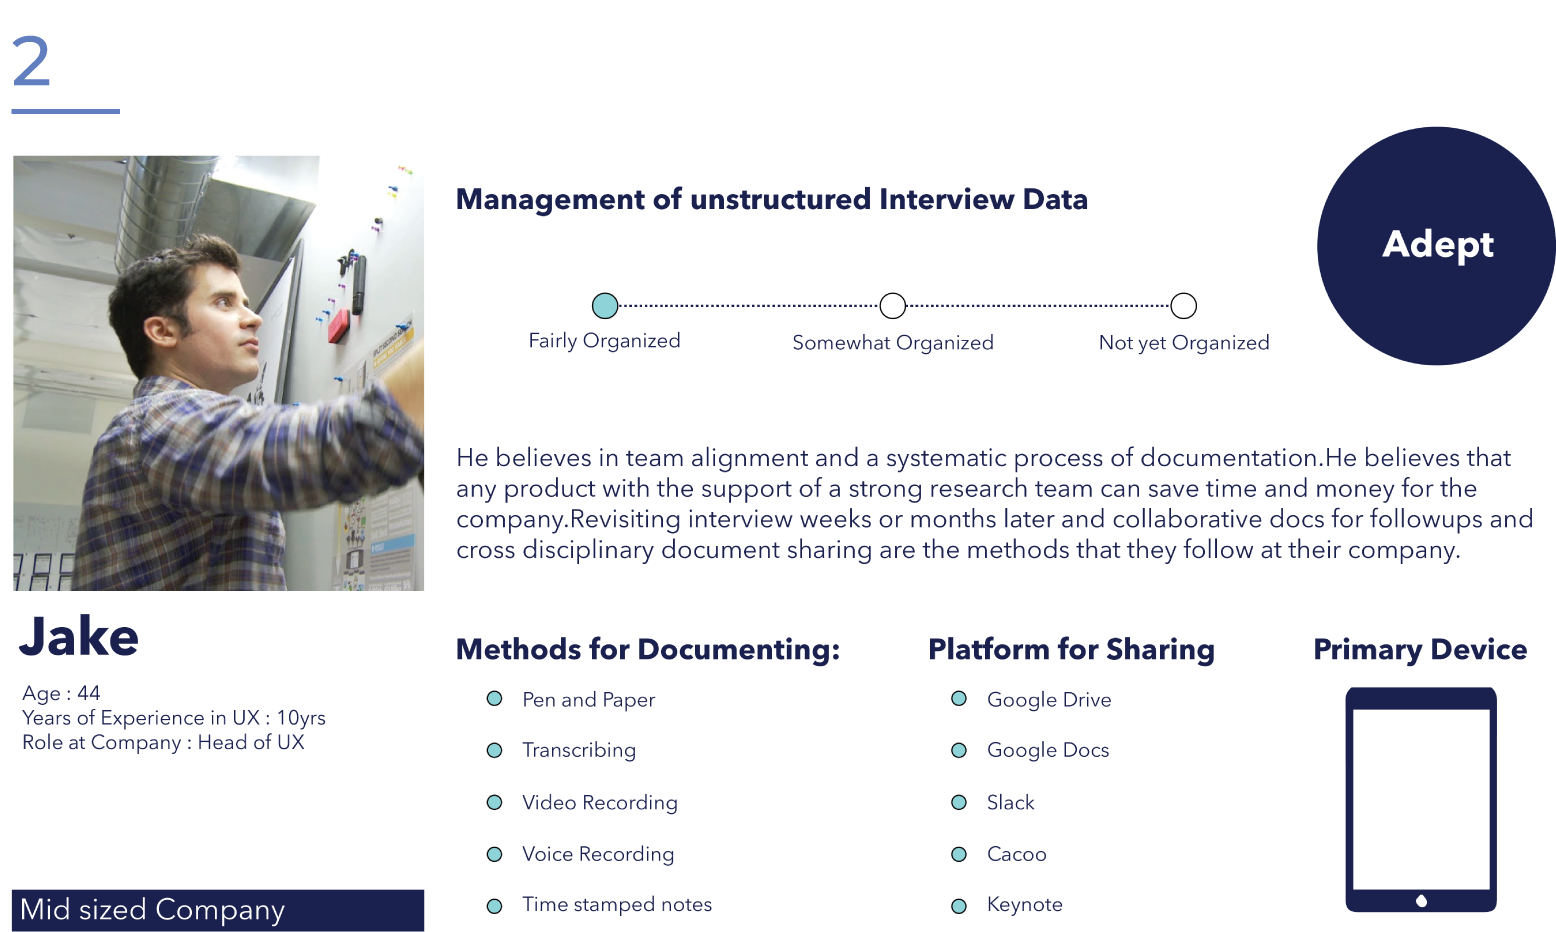
We want engineers to see the data we collect. So they know why they are building the particular feature and empathize with the users. ”
— Jake ( Mid sized firm)
Task Analysis
A technique used to understand the current workflow of designers at different stages of responsibility. This study was adopted as I believe that the design of the platform that we develop should be a natural extension of the current practices followed by the note takers.
‘Form follows function’ a theory that I have rigorously followed in architecture which transcends to my approach to UX design.
We accompanied the designer during their data collection and aggregation process and observed their note taking techniques and the steps they took to store and transcribe the files. We documented how they currently translate their research finding with others in the team.
"
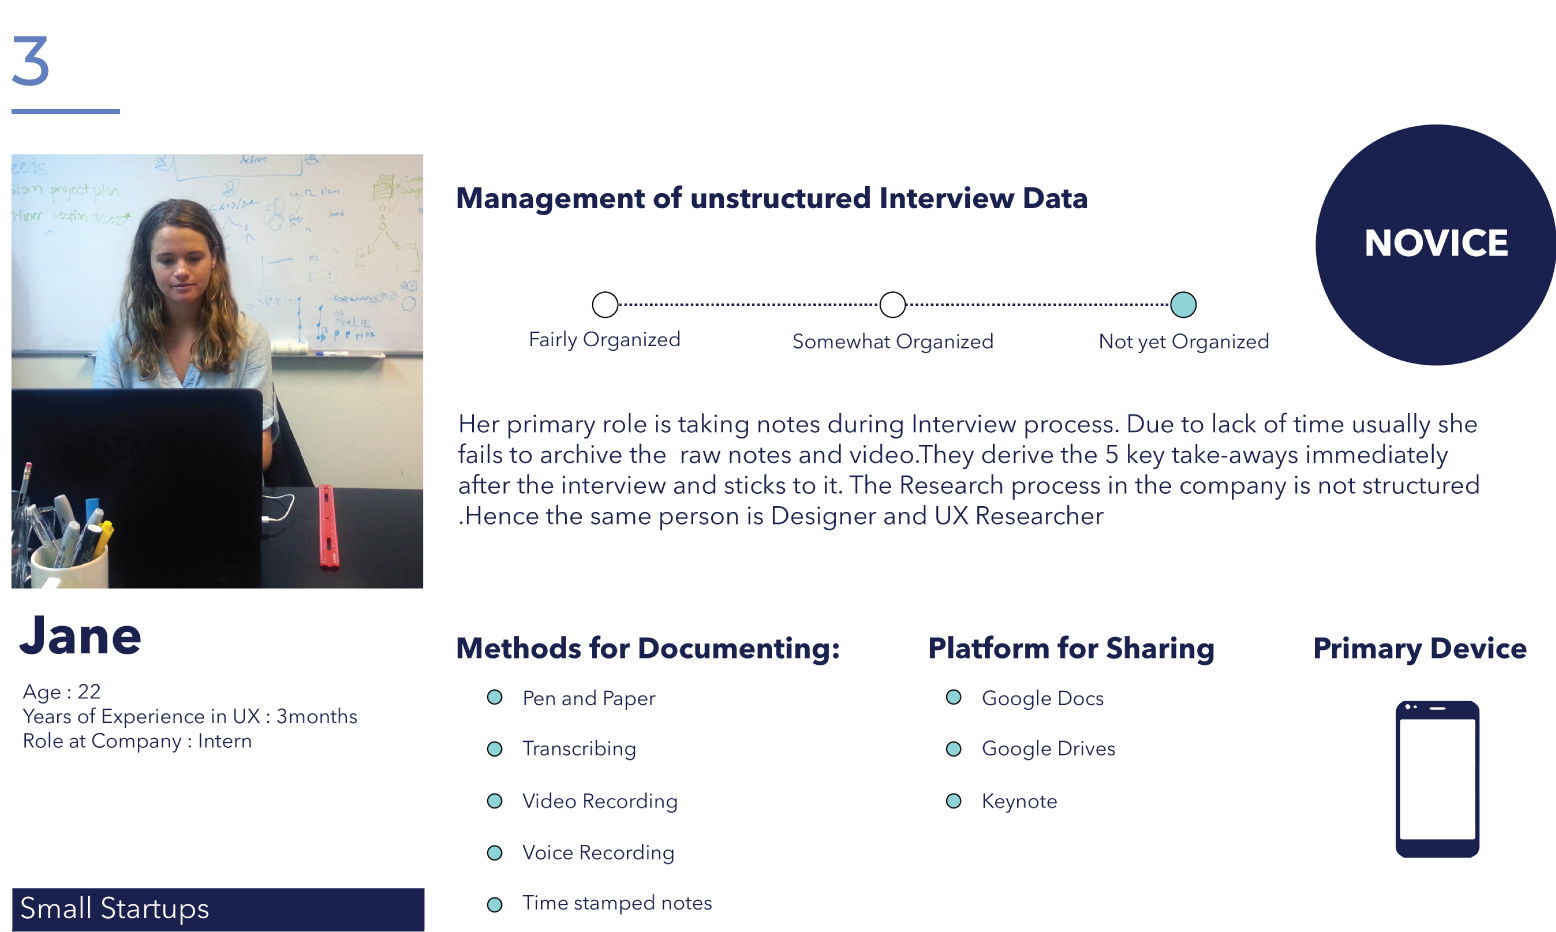
I do not have time to re-read the old user notes. Sometimes I cannot remember where I wrote them ”
— Intern (Design studio)
"
When the designer who conducted the interviews left the company, we had difficulty in transferring all the knowledge to the new recruit as we never follow a system for documentation.”
— Priya (Startup)
Insights from Task analysis :
It was evident that the pain point was not limited to unbiased derivation of the research findings. The issue amplified due to the arduousness in aggregation and synthesis during data collection which led to difficulty in deriving user pain points.
Personas
We created our three main personas ( a relatable characteristic of our target audience that highlights their behaviour, needs and motivation).
INQUIRY
04
During this research, a lingering question that kept Rebecca and me up at night was - What would be the ideal process to derive insights from all the raw unstructured data collected by the note taker and the audio recordings gathered during the data gathering phase for any designer?
We reached out to -
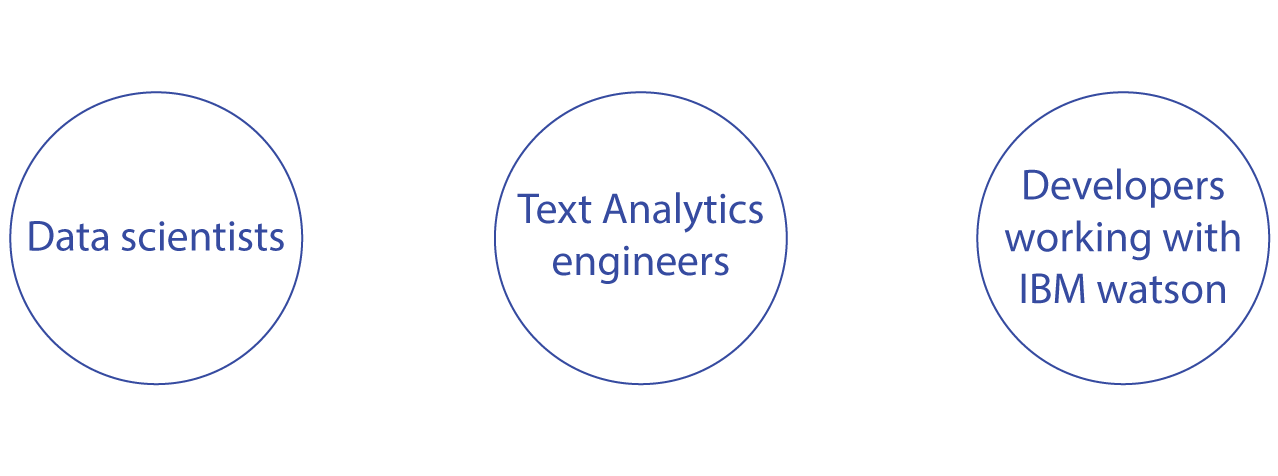
They introduced us to the idea of Natural Language Processing (NLP). The NLP service had the ability to group synonyms and categories to derive insights from large data. We used IBM Watson platform to analyze the interviews that we collected to understand what the system could offer. Though Watson had the ability to scan for the words mentioned by the end user and the sentiment attached to it, we decided to bucket all the data gathered under positive and negative sentiment attached with the data.
We were excited to integrate Natural language processing to analyze the raw data and visualize the insights to easily derive patterns from the data gathered by the designers.
Theory formulated :
Data Discovery — The UX researchers must be able to identify the key data mentioned during the various research that they conduct. The NLP platform could also suggest the key data mentioned the most from the entire data repository.
Data Inquiry — They keywords(key data) derived could be analyzed whether it was mentioned positively or negatively and in what context by the customer for any product. This process generally results in a sequence of queries to the underlying data set.
Visualization — Once the data has been derived and analyzed, a suitable visualization is required to communicate the research findings across all the platforms.
Proposed theory
We formulated a theory that, if the data stored in word doc or as notes by the designer was scanned by the system to suggest the most recurrent pain-point mentioned frequently by the end users of their service or product.
The data will also indicate the sentiment attached to it.This could possibly be valuable to see patterns for the UX researchers. The data visualization of the above gathered information can also be shared across teams to communicate quickly by color coding the sentiment or visualizing the feature that requires maximum attention over the other features to derive insights that is relevant across each stakeholder.