MOTIVATION
01
UX researchers use customer feedback to identify patterns in the problem reported by the customer. These patterns govern the direction for deeper research and product development. The current data aggregation in most technology companies is accomplished on spreadsheets. This often leads to loss of critical information or customer feedback in the large volume of data.
This project aims at better answering the question every UX researcher is troubled with -
“Are we solving the right problems for our customers?”.
The motivation for undertaking this project is to derive unbiased and meaningful insights from the customer interview data using machine learning.
THEORY
Proposed
02
The theory proposed to achieve this involves Text Analytics and Natural Language Processing. These concepts can be used to analyze text and extract metadata from the unstructured content such as categories, sentiment, emotions and relations. Another key pain point lies in visualizing the dataset to enable cross disciplinary communication about the research findings.
In order to solve the above problems, we adopted a multimodal framework that uses Natural Language Processing to transform the raw data into a format which could be easily visualized .
This framework is a crucial component in automating the tedious and manual process of qualitative research on customer feedback. The patterns generated by visualizing the customer pain points, answers critical questions regarding the issue such as who, where, when and why for the UX researcher.
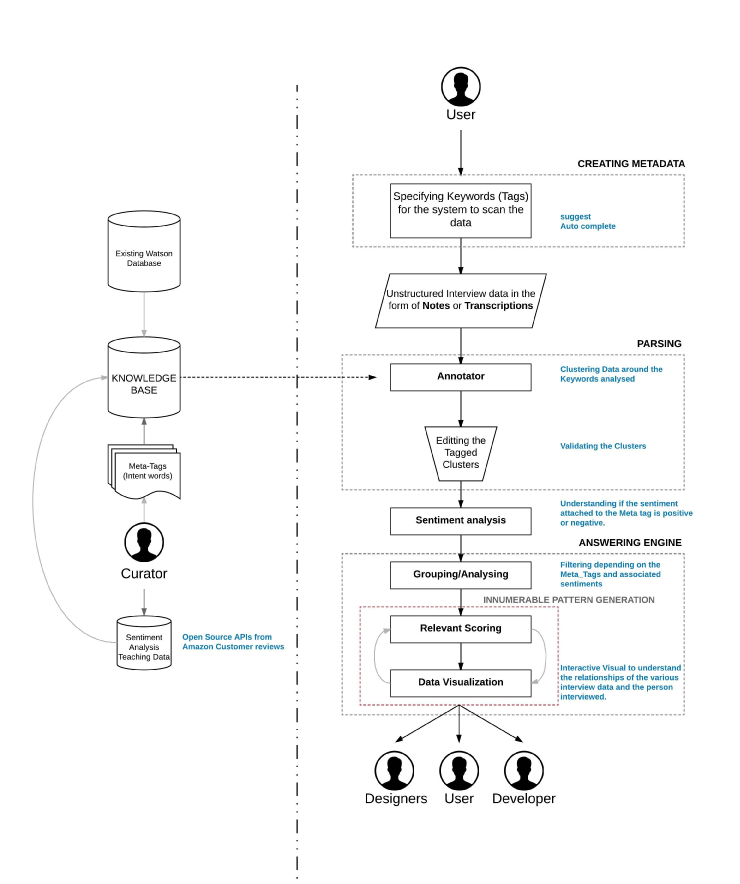
Overall architecture of the proposal
VALIDATION
03
Concept Testing
In order to validate if the theory met the needs of the target audience, we tested the concept with a group of UX designers(participants) working on an application for travelers. The designers(participants) manually segregated the data according to the multi-model system we proposed.
The process adopted by the participants -
Step 1 : Before conducting interview for their application, the designers created keywords that would be valuable to derive from the interviews they would conduct.
Step 2 : After aggregating 28 interviews,they tabulated the data under recurring words in all the interviews.
Step 3 : The words were further sub categorized as positive and negative sentiment.
Step 4 : The designers made a group of the interviewees who mentioned each of the keywords and the sentiment attached to it.
Spreadsheet used by the designers to execute that above proposed theory manually
28 Interviews 33 Keywords
"
We were able to draw more insights and communicate without bias between team members"
— Jason ( Participant)
Features and functionality matrix
After close observation and constant brainstorming we listed out all the features and functionality that we deemed would be valuable for the process. The matrix was categorized under three primary parameteres-
User value | Business value | Tech Value and we rated them as low, medium, and high depending on the value of each features with respect to the above parameters.
User value - determines how valuable the feature is for the user.
Business Value - how valuable this feature is for the business.
Tech value - how easy or time consuming it is to build the feature.
This approach helped us to converge to formulate our MVP.
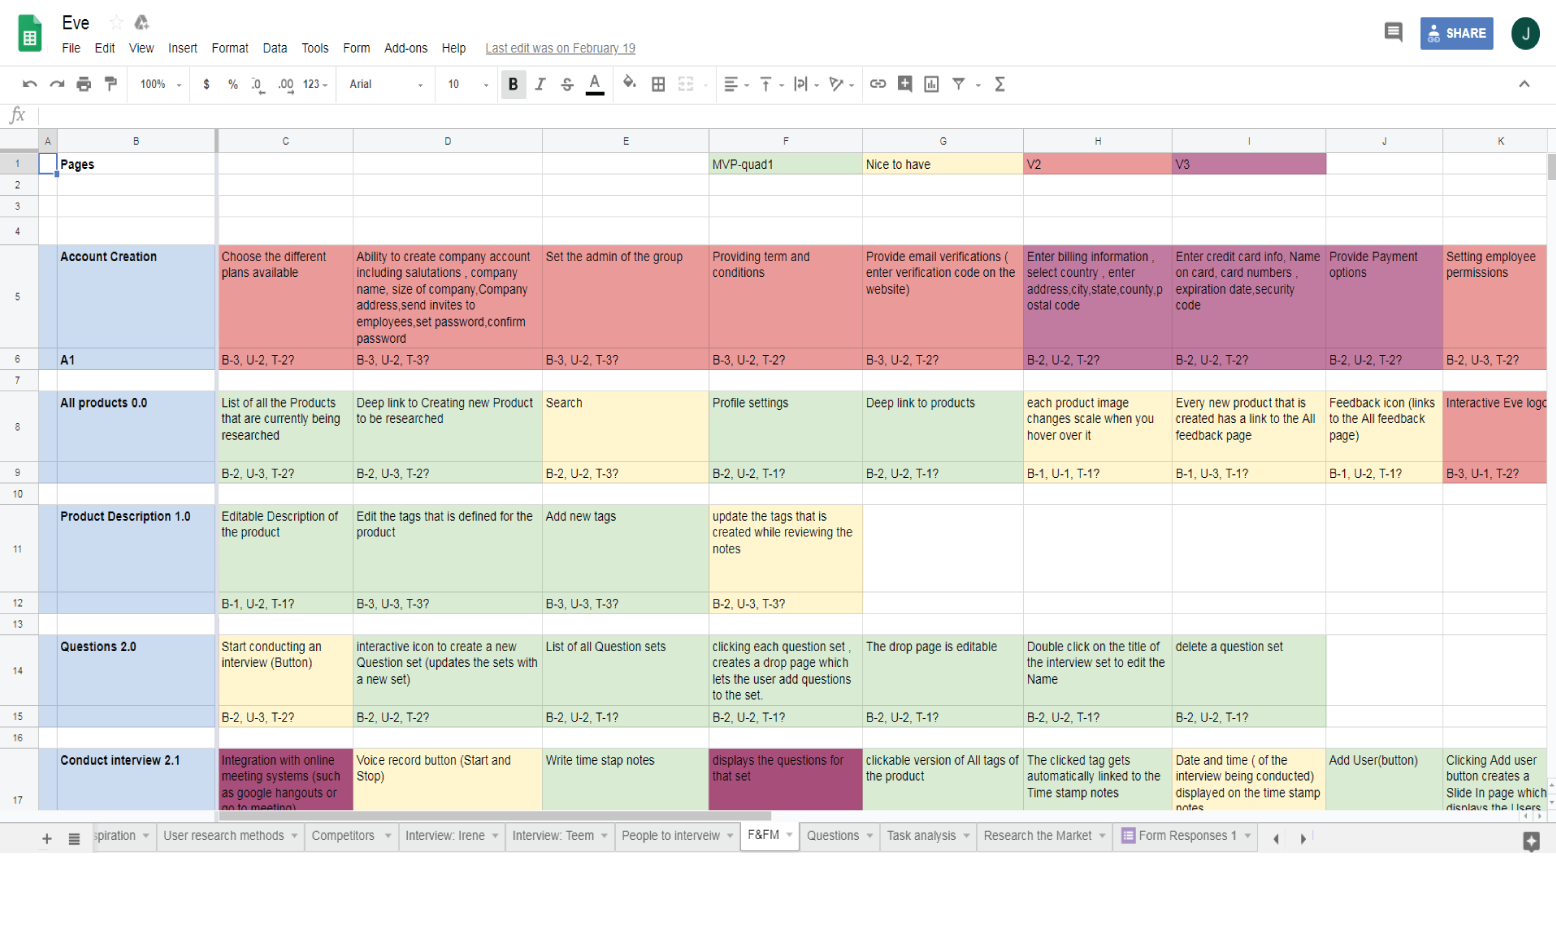
Mapping and organizing the features and functionality
Card Sorting
A tool used for determining the taxonomies. It gave us an input on content hierarchy and flow. We conducted card sorting with 10 participant all designers to understand their user flow.
Card Sorting
Site Map
The above tool helped us define our MVP. Once we assessed our information architecture and features, we made our site map. It made it easy to visualize the basic structure and navigation of our digital product. Though the user flow was very complex, we were able to simplify the navigation to five basic steps to arrive at the analytics page.
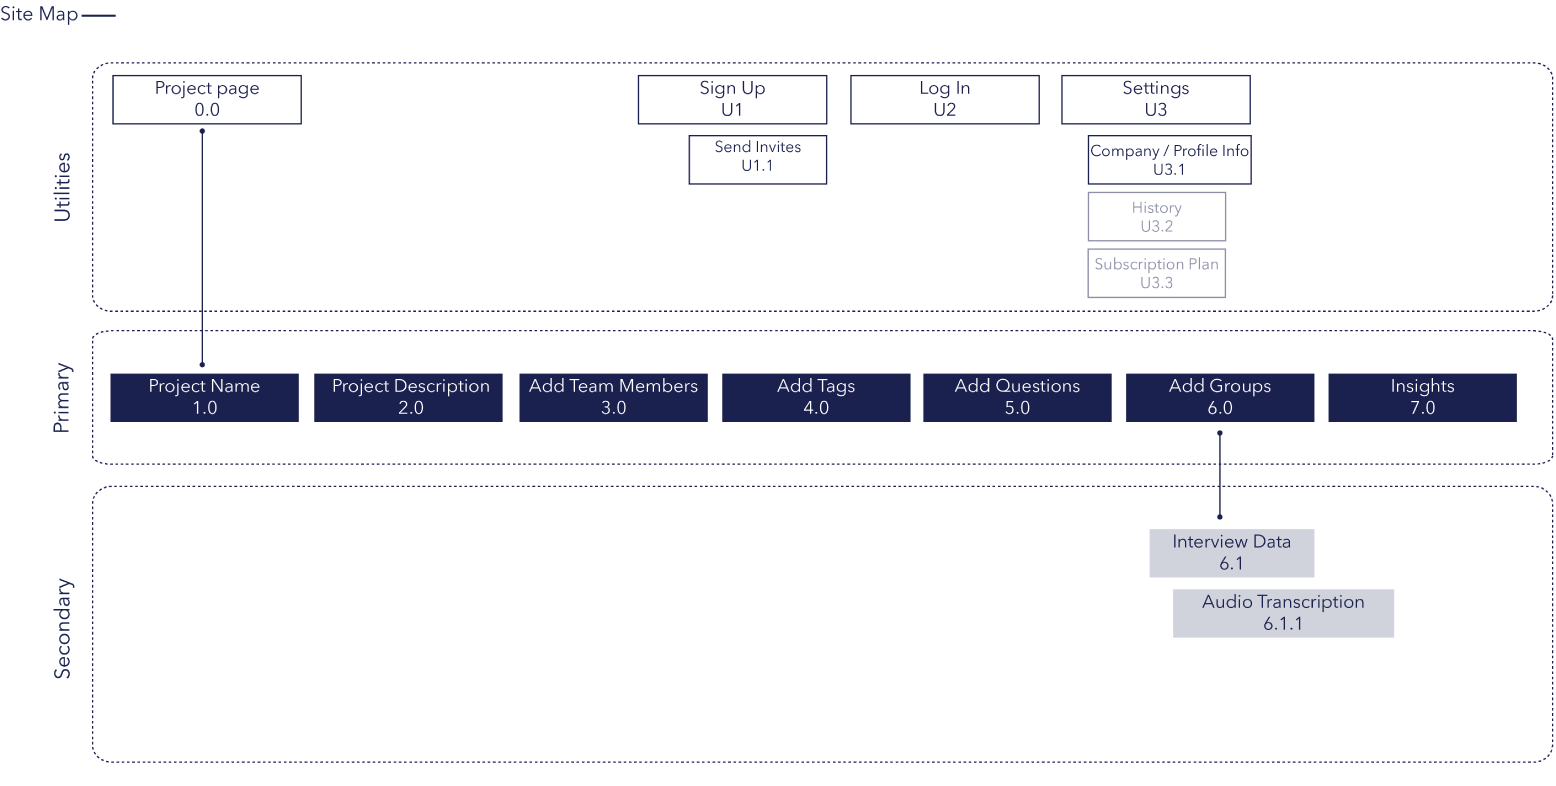
Site map after 7 iterations of sketching and user testing
Low Fidelity prototyping
Through this process we confirmed that the theory we were proposing was a powerful tool to help designers.
We made our initial sketches of the wireframe to continue with our process of constant user testing and iteration.The initial sketches helped us in the process of brainstorming and creating a basic journey map and a list of flows that could be valuable for our audience.
Iteration 1 : Derived from all the above research conducted
Iteration 2 : After user testing our first sketch we re-iterated to incorporate the observations.
High Fidelity prototyping
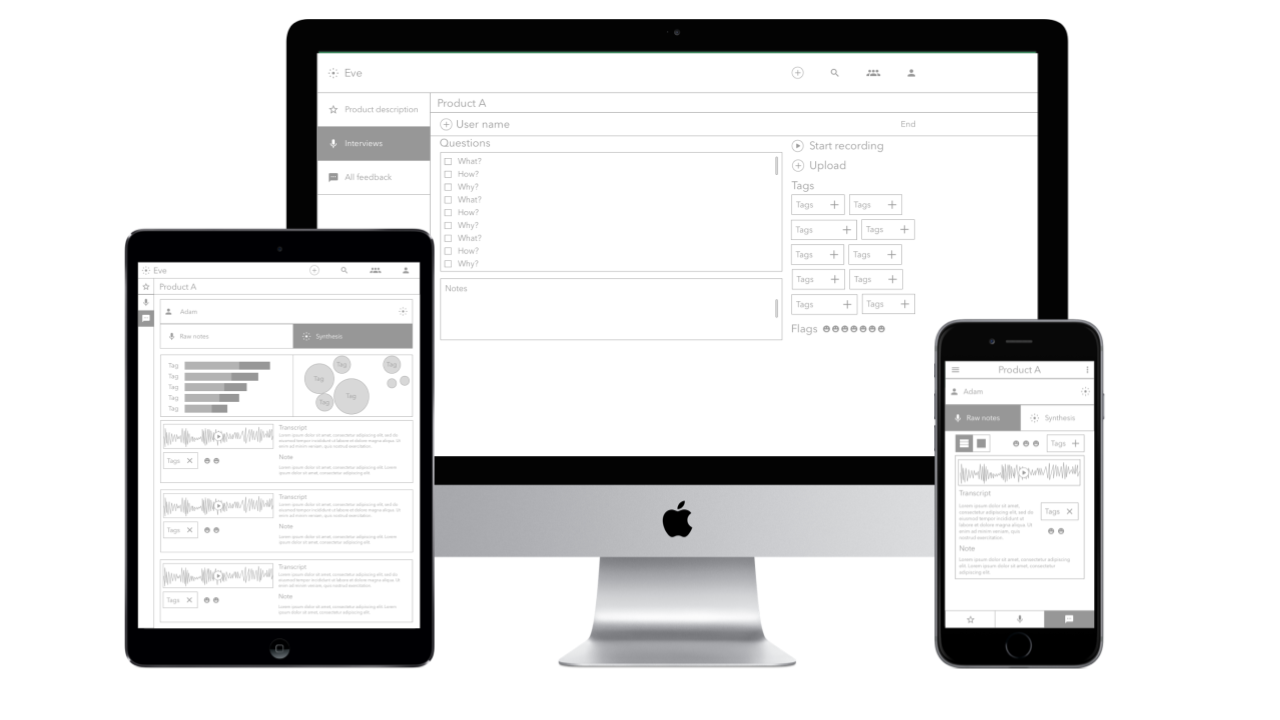
I conducted Participatory Research techniques to test the prototypes from the perspective of the stakeholder (mostly developers) as well as the users (UX researchers). This helped in creating exploratory dashboards and wireframes for different use cases in the platform. After continuous iterations and user testing, Becca and I created high fidelity prototypes as we wanted to reach out to senior UX researcher at IBM and headspace for further feedbacks.This methodology places users at the core of the project.
Third version of the High fidelity prototype that was used for user testing
The Challenge
The key challenge that I encountered was to work in conjunction with data scientists on machine learning principles. Being new to this field, I was proactive to learn basics of machine learning by reading research papers, attending courses and talking to professors to understand the structure around which our platform could be created. Being the co-creator I had the responsibility to connect with experts who are dealing with Watson’s NLU service and UX researchers working at companies like Google, Headspace, and IBM to help us refine our model and its architecture.
Currently along with a data science student from my University, I am looking at various possible algorithms that could generate actionable insights in our platform.
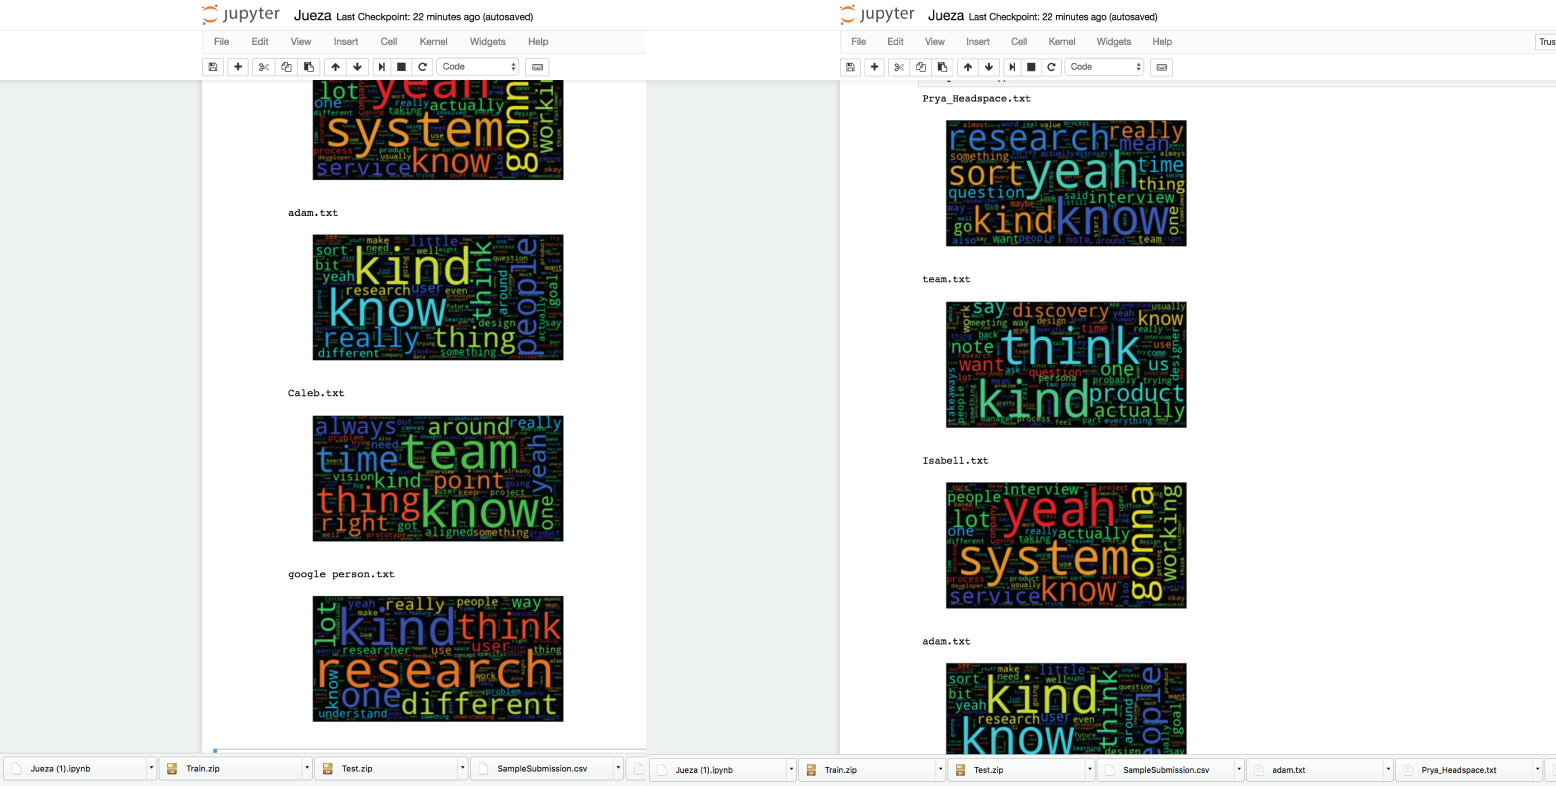
Word Cloud Experiments with the data science students
What Next?
I consider this platform to have a great potential as I believe that Computer Analysis of data will extend our understanding of our customers into new frontiers. This was a platform that made me think how technology can understand and assist common man.
In the next phase of the project, I plan to take this research further to develop the platform.We are in touch with talented data scientists at Harbour.Space University who are eager to work with us to test out our various hypothesis using Watson’s NLU service. I also plan on taking a part-time course at the university on Machine Learning to understand the concepts of text analytics to further enhance the platform.
The project has ignited interest among many UX designers and data scientists in the industry who are keen to help us in this endeavor.
I am open to suggestions and collaborations for this platform. Feel free to drop in an advice or just email me to know more about the project.